Overview
Every CMS instance starts out as a fast environment that has been setup and configured to meet the needs of each customer. However, over time even the best CMS instance can become slow due to changes in the configuration and updates to the implementation. Some of the common reasons for this slowing are:
- The addition of links in a website that establish new dependencies between pages
- The addition of heavy content including images and other binary files as attachments can impact the perceived loading and publishing times of pages
- Changes to template code that may not be optimized for the page loading experience
This can often results in slow page loading and re-rendering after content has been updated as well as slow publishing of assets to websites in the hosting environment. Here are some of the ways to diagnose and remediate these issues in your CMS.
Slow Page Loading Across the CMS
If you find that some of the pages in your CMS are slow to load but the exact asset is not clear, consider using the new Slow Performing Templates report. Look for high execution times and API Calls. Here's how:
| # | Diagnostic Steps |
| 1 | Select [Reports]/[Assets]/[Slow Performing Templates] (Figure 1) |
| 2 | If the Execution Time for any of the templates is greater than 200 seconds then look at this template for possible performance improvements |
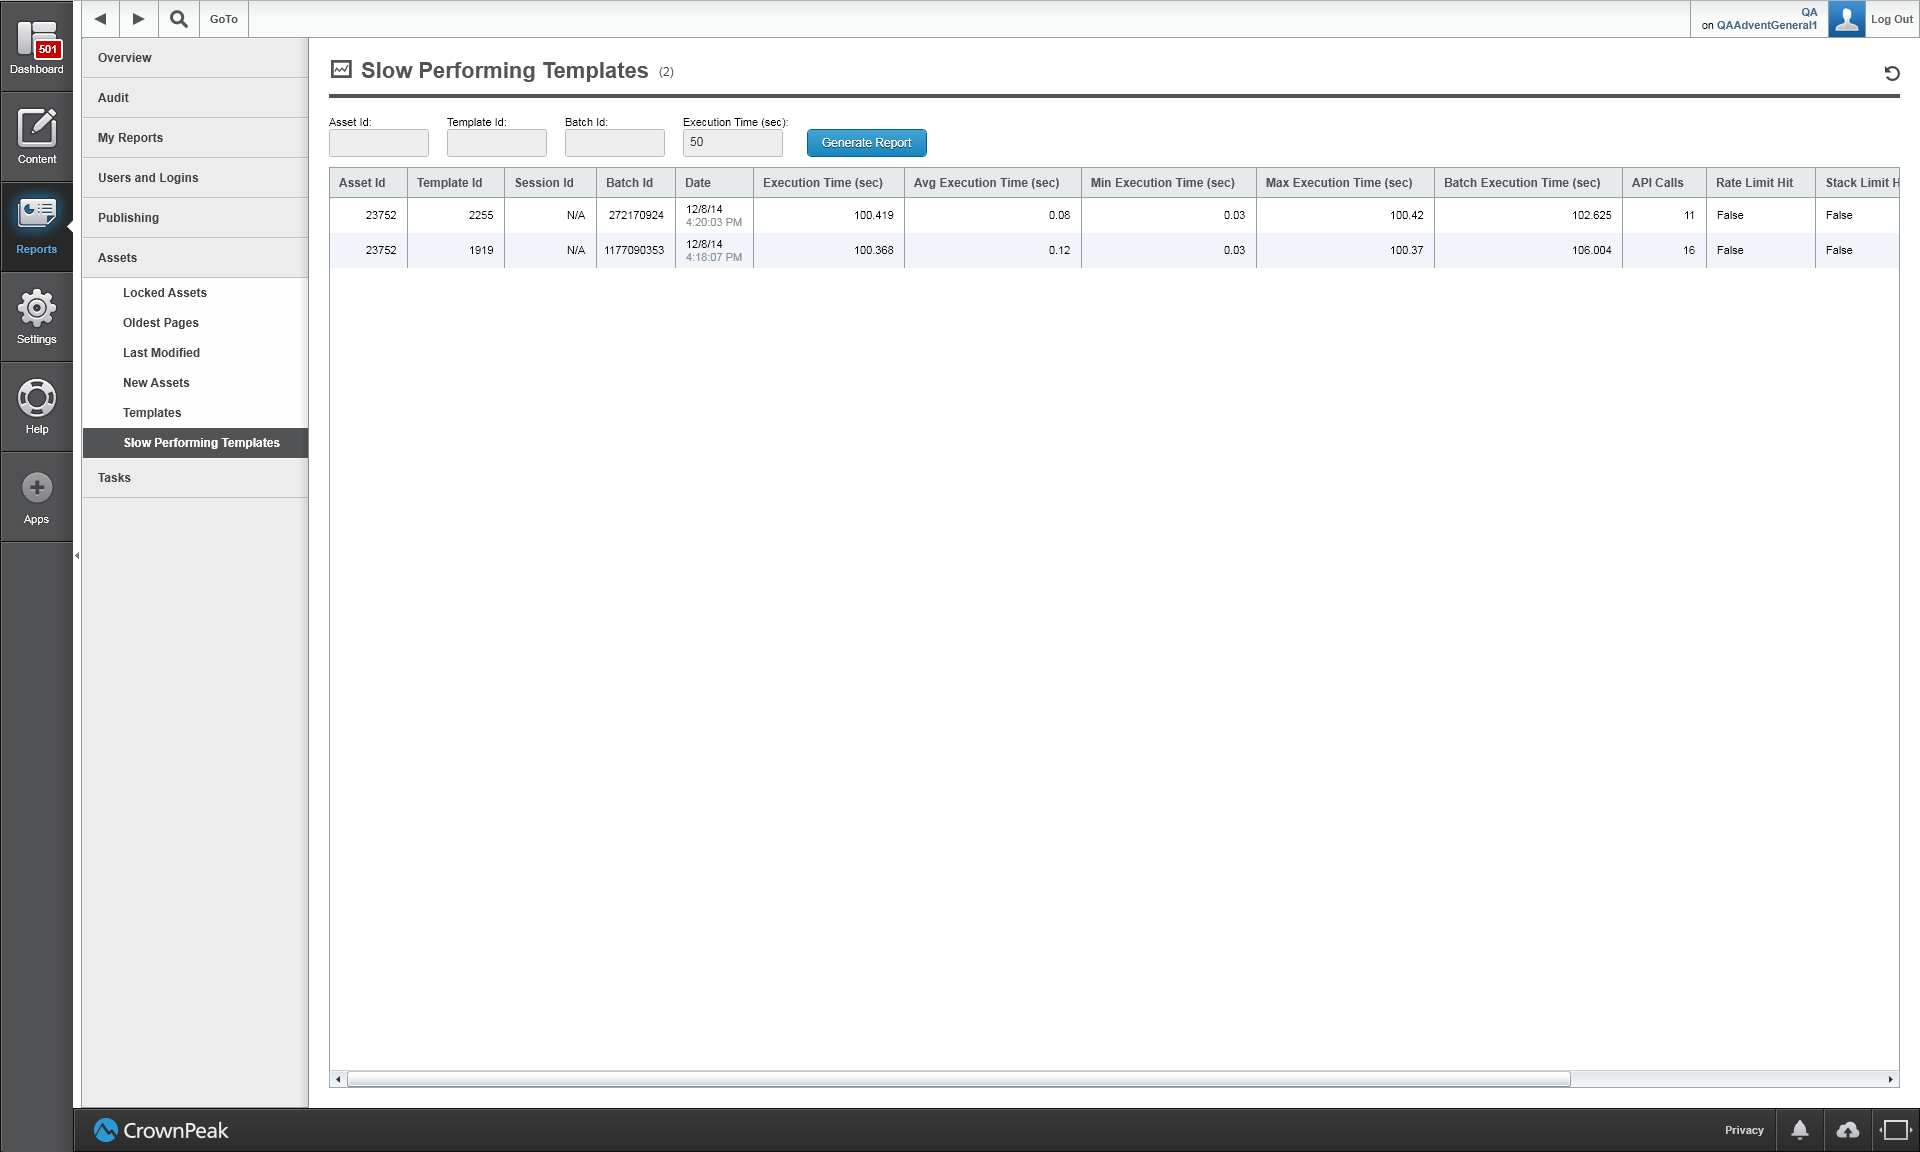
Figure 1. Slow Performing Template Report
| Column Name | Definition |
| Execution Time | The total render time for a particular asset/template combination. Using the filter will narrow down the returned results to asset renders that took longer than the entered threshold value. |
| Asset Id | Represents a specific templated asset in the system. |
| Template Id | The id of the template file running. This is useful for comparing the performance of a particular template (i.e. output.aspx) across assets. Combine this with a filter on a specific asset id to get a historical view of an asset’s rendering performance for a particular template layout. |
| Batch Id | A grouping of template files that render in a sequence for a single asset. For example, an asset rendered using an output.aspx layout will often trigger the assetfilename.aspx to run. |
| Batch Execution Time | The aggregate execution time of all the templates included in a batch. |
| API Calls | The number of API calls made in the template. |
| Rate Limit Hit | Indicates whether the configured rate limit has been reached. Once reached, API calls will be throttled. A value of ‘true’ would indicate excessive API usage. |
| Throttle Time | The amount of time that was throttled due to excessive API usage. |
| Max Stack Size | The largest stack size reached during execution of a template. |
| Stack Limit Hit | Indicates whether the configured stack limit has been reached. Once reached, the template will stop executing. This may be a symptom of excessive/infinite recursion. |
| Session Id | Indicates the publishing session the render took place in. A value of N/A indicates the template was rendered for previewing. |
If a page is slow to load or if re-rendering after updating the content is delayed, then the best option is to determine if the output template code is not optimized for the page loading experience.
| # | Diagnostic Steps |
| 1 | Open the asset in question |
| 2 | Select [Overview]/[Information] in the right accordion |
| 3 | Look at the “Performance Data” section (Figure 2) for clues to the cause |
| 4 | If the total execution time is greater than 10 seconds then look at the individual methods in the list |
| 5 | If the Count for any of the methods is greater than 20 then open the output template, search for the method (Control-F / Command-F), and look for loops (for, while) in the template code |
| 6 | If the Duration for any of the methods is greater than 2 seconds then consider adding filters (GetFilterList() method) to the code to increase response times |
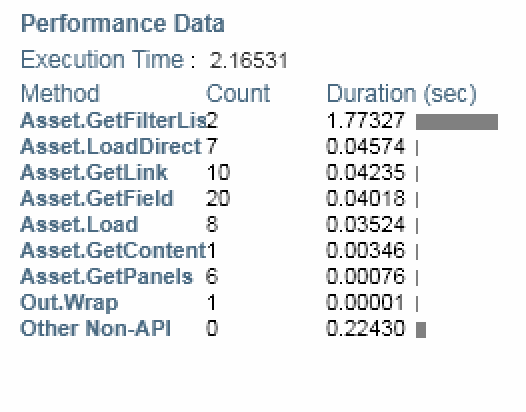
Figure 2. Right Accordion
Next, look at past versions of the template to see if a recent change is the cause.
| # | Diagnostic Steps |
| 1 | Select [Properties]/[Performance] in the right accordion (Figure 3) |
| 2 | The top chart will show the performance of the output template by version. Note the Date range on the version in question. You can then perform a version compare report to check the possible cause of the slowdown |
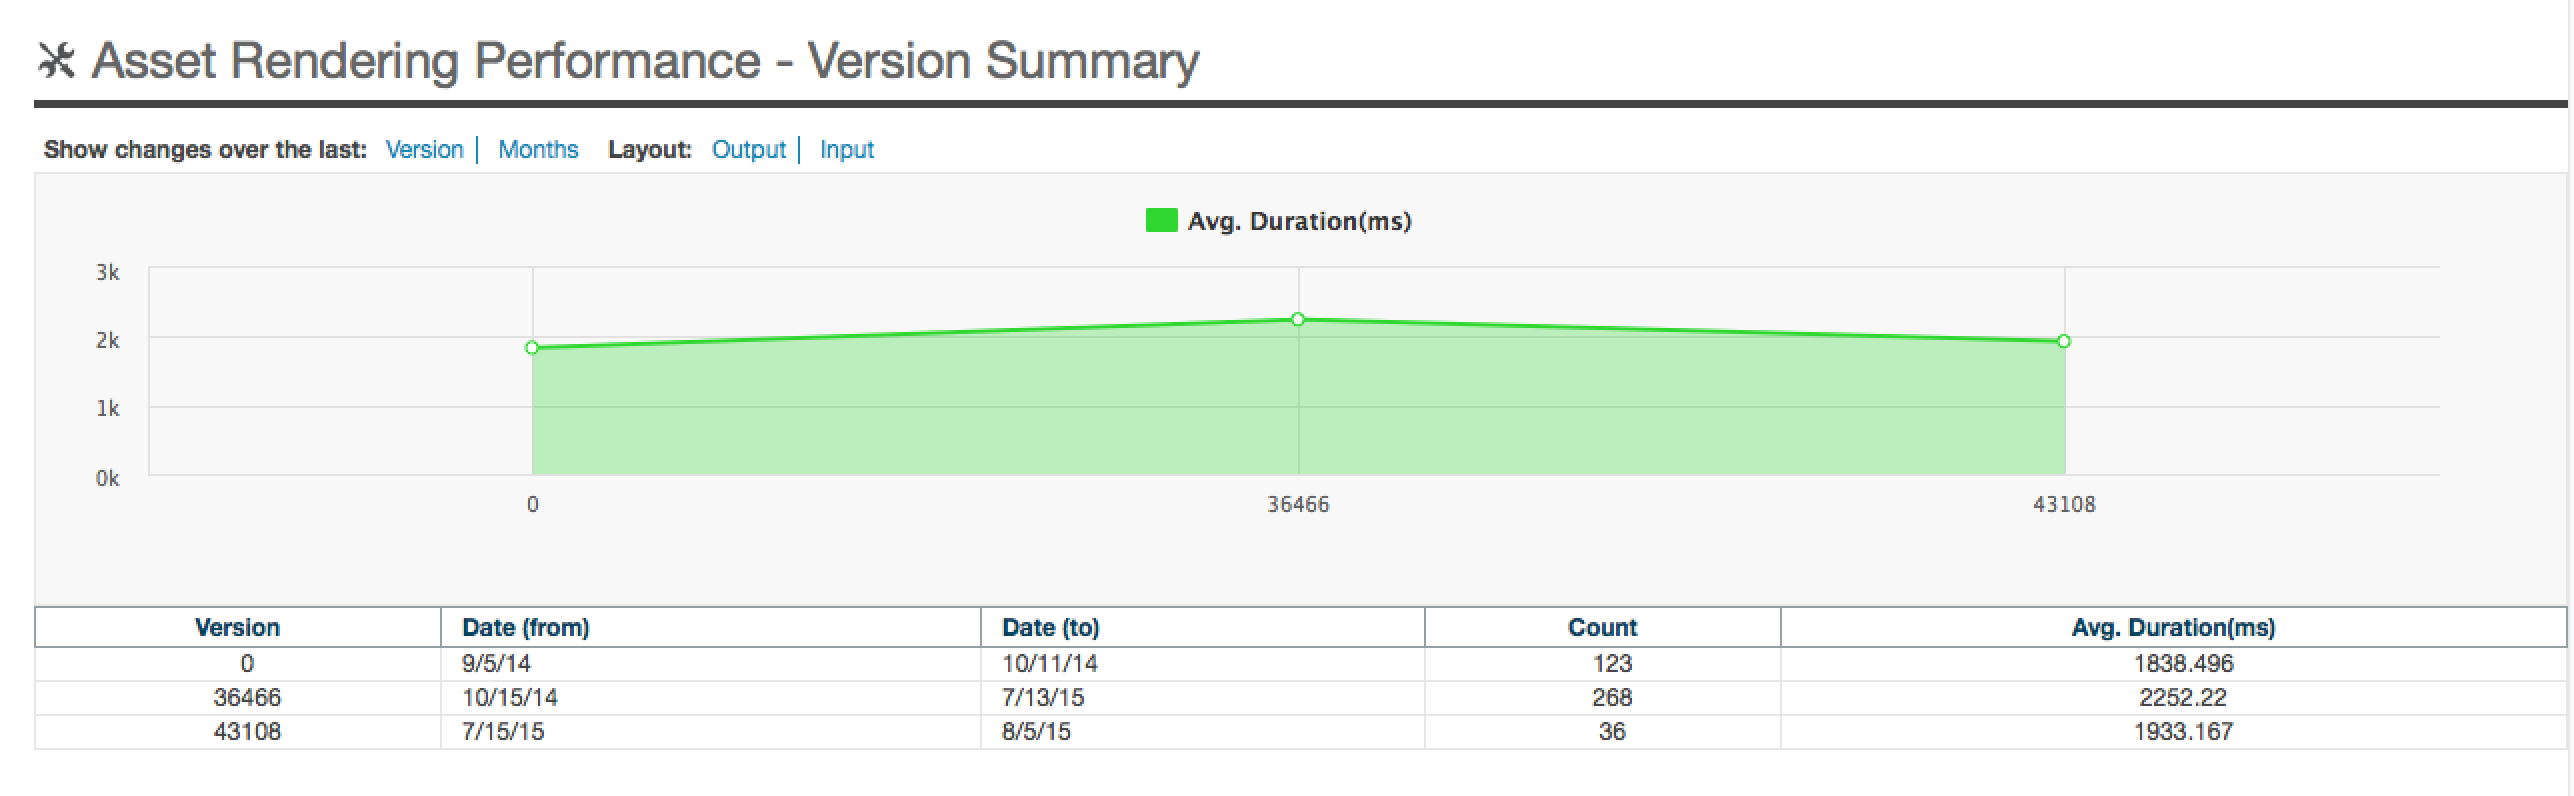
Figure 3. Asset Performance page in right accordion
Publishing Concerns
If it is taking a long time to see the publishing results on the hosted website, the first step is to determine if the publishing process has queued up too many assets. Perhaps the automatic dependency generation process has created a large list of files to publish. This is typically caused by links in a website that establish new dependencies between pages that may not be necessary.
Running the new Queue Size report will show the number of dependent assets that have be queued for publishing.
| # | Diagnostic Steps |
| 1 | Select [Reports]/[Publishing]/[Queue Size] (Figure 4) |
| 2 | If the grey bar is larger then the green bar then the dependency options may need to be updated |
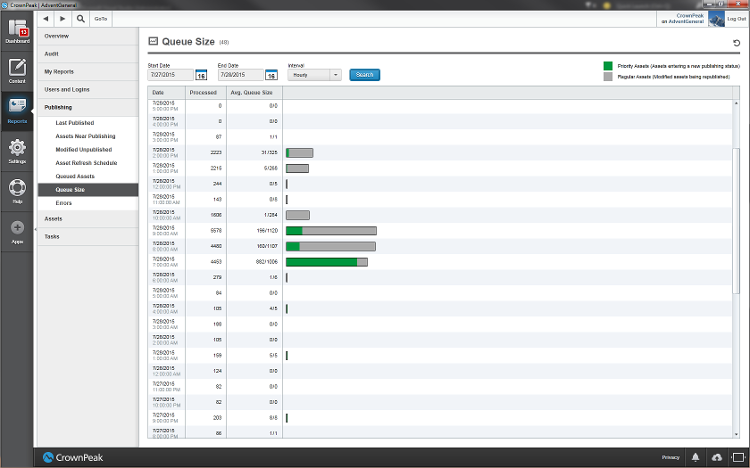
Figure 4. Publishing Queue Size Report
The next step is to look at the updated Dependencies page for the current asset:
| # | Diagnostic Steps |
| 1 | Open the asset in question |
| 2 | Select [Properties]/[Dependenies] in the right accordion (Figure 5) |
| 3 | The two tabs will show you the number of assets that are connected to and from this asset. If there is more than 1 page, there may be unnessesary dependencies slowing the publsihing times. |
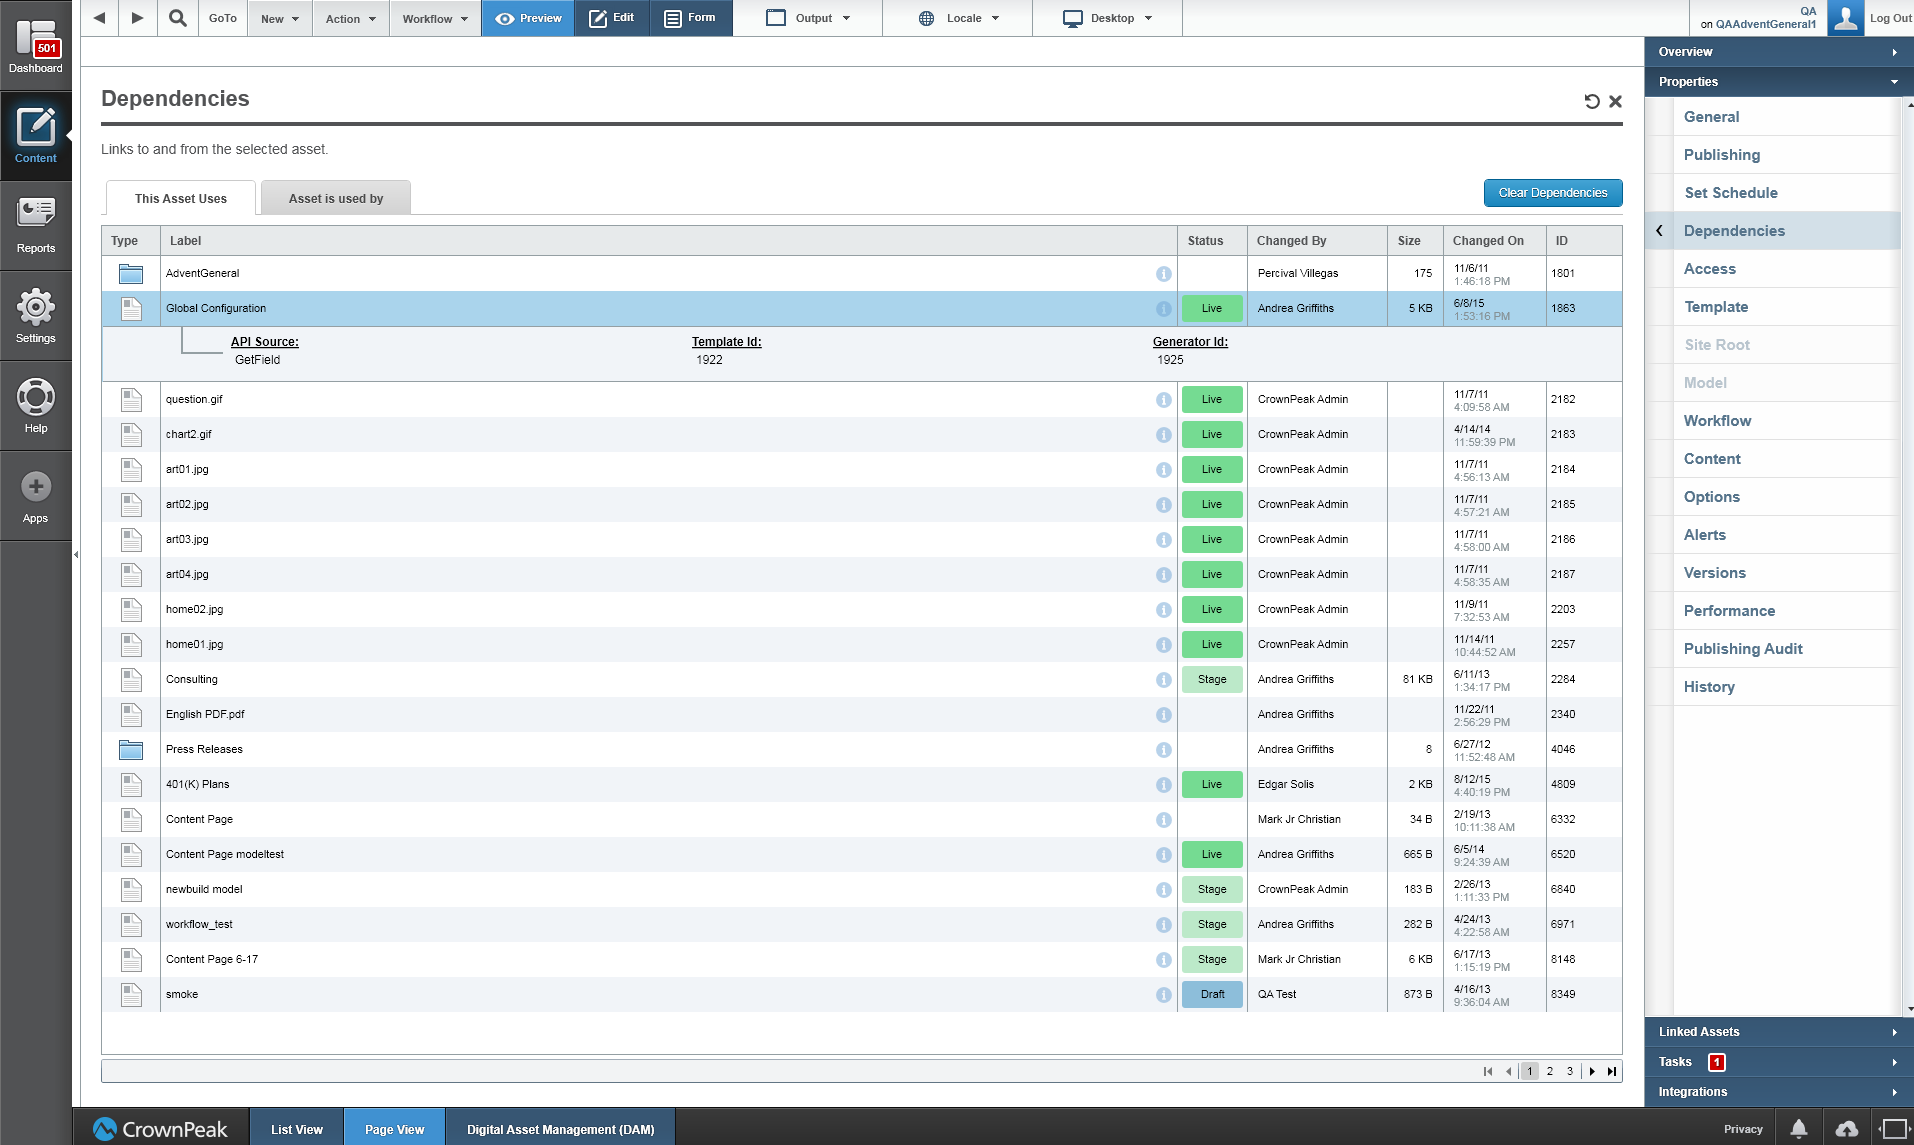
Figure 5. Dependencies Page for the Asset
There are a few options to remediate this issue:
| # | Diagnostic Steps |
| 1 | Open the Publishing Monitor, cancel the publishing process, then publish the asset again with the "Include Dependency" checkbox off |
| 2 | Press the [Clear Dependencies] button on the assets' Dependency Propertypage |
| 3 |
Submit a ticket to support@crownpeak.com to set the dependency depth to 0. The next publishing event will only include the selected asset Note: This will affect all publishing in the CMS. |
| 4 |
Submit a ticket to support@crownpeak.com to switch to o the Manual Dependency option Note: Only the assets that are programmatically linked, using the asset.AddDependencyTo() method, will be published with the selected asset. This option should be tried after other options have not been successful. |