Overview
DQM is a powerful tool, which allows you to check your website for issues against your personalized checkpoints such as making sure every page has a title, spelling and brand standards.
The DQM features are presented in the CMS in three key areas:
- An application link to the full DQM Dashboard Application
- An asset accordion that lets you see the findings for the asset you are working
- A CMS dashboard that displays the findings from all recently checked assets
You will need a DQM account to use these new features. Please contact customer service for more information.
Accessing the Full DQM Application
You can access the full DQM dashboard application from the Apps section of the CMS. When you select the option, you will open a window to the DQM application and all of the results from the website weekly scan.
To quickly and easily access your DQM login, click on [Apps][DQM] from the left-hand navigation panel. (Figure 1)
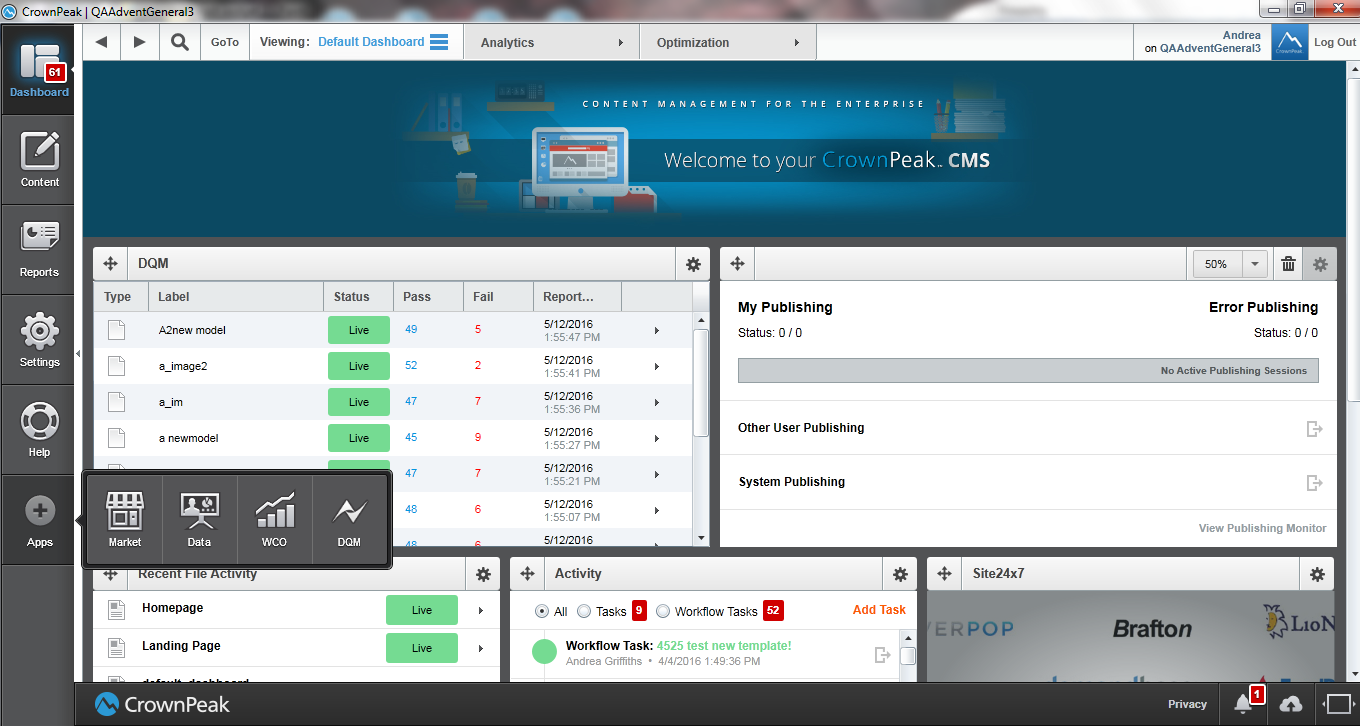
Figure 1 - DQM Application Link
DQM Accordion and Editing Experience
Connector:
Prior to using the new features in the CMS, you must create a DQM Connector.
Use the following steps to create the Connector:
- Navigate to [Settings][configuration][Connectors]
- Press the [Add Account] button at the top of the page and Select the [DQM] Icon
- Enter the required information and click [Save]
- The DQM Connector will appear in your list
Now that you have a DQM connector, you can check your individual pages for the DQM results or add a DQM Dashboard widget to view all recently checked pages at a glance.
DQM Accordion and Editing Experience:
For individual pages/assets, you can access information from the DQM via the right-hand accordion in real-time while editing an asset. This new integration offers the ability to submit website pages in [Preview] along with the [Stage] and [Live] workflow states for review. As a result, you will see the findings for your quality and compliance checks on your pages. For visual elements of the page, the CMS will highlight them in the Edit mode, additionally; DQM will re-check the page every time you save it.
In the accordion, you will see two drop-downs, one which represents the asset stage: Preview, Stage or Live, the other drop-down represents the type of compliance check you want to view. You can view: All, Accessibility, Brand, Legal, SEO and Usability. These checks will all be based on your information in DQM (Figure 2).
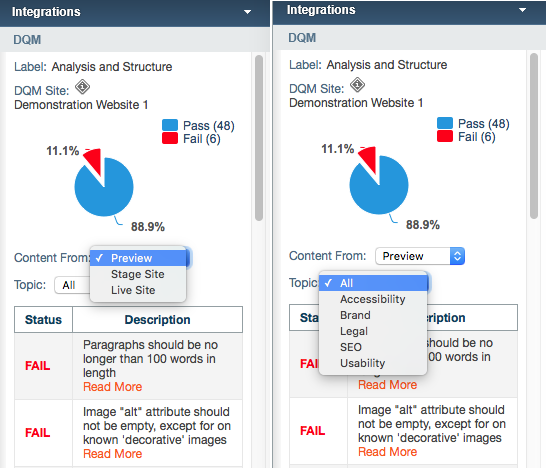
Figure 2 - DQM view options
While editing an asset using In Context Editing (ICE) the issues found by DQM will display in the accordion. Furthermore, visible issues will be highlighted with red boxes in the edit window (Figure 3). The red boxes will display if you select the “Click here to highlight” option in the table.
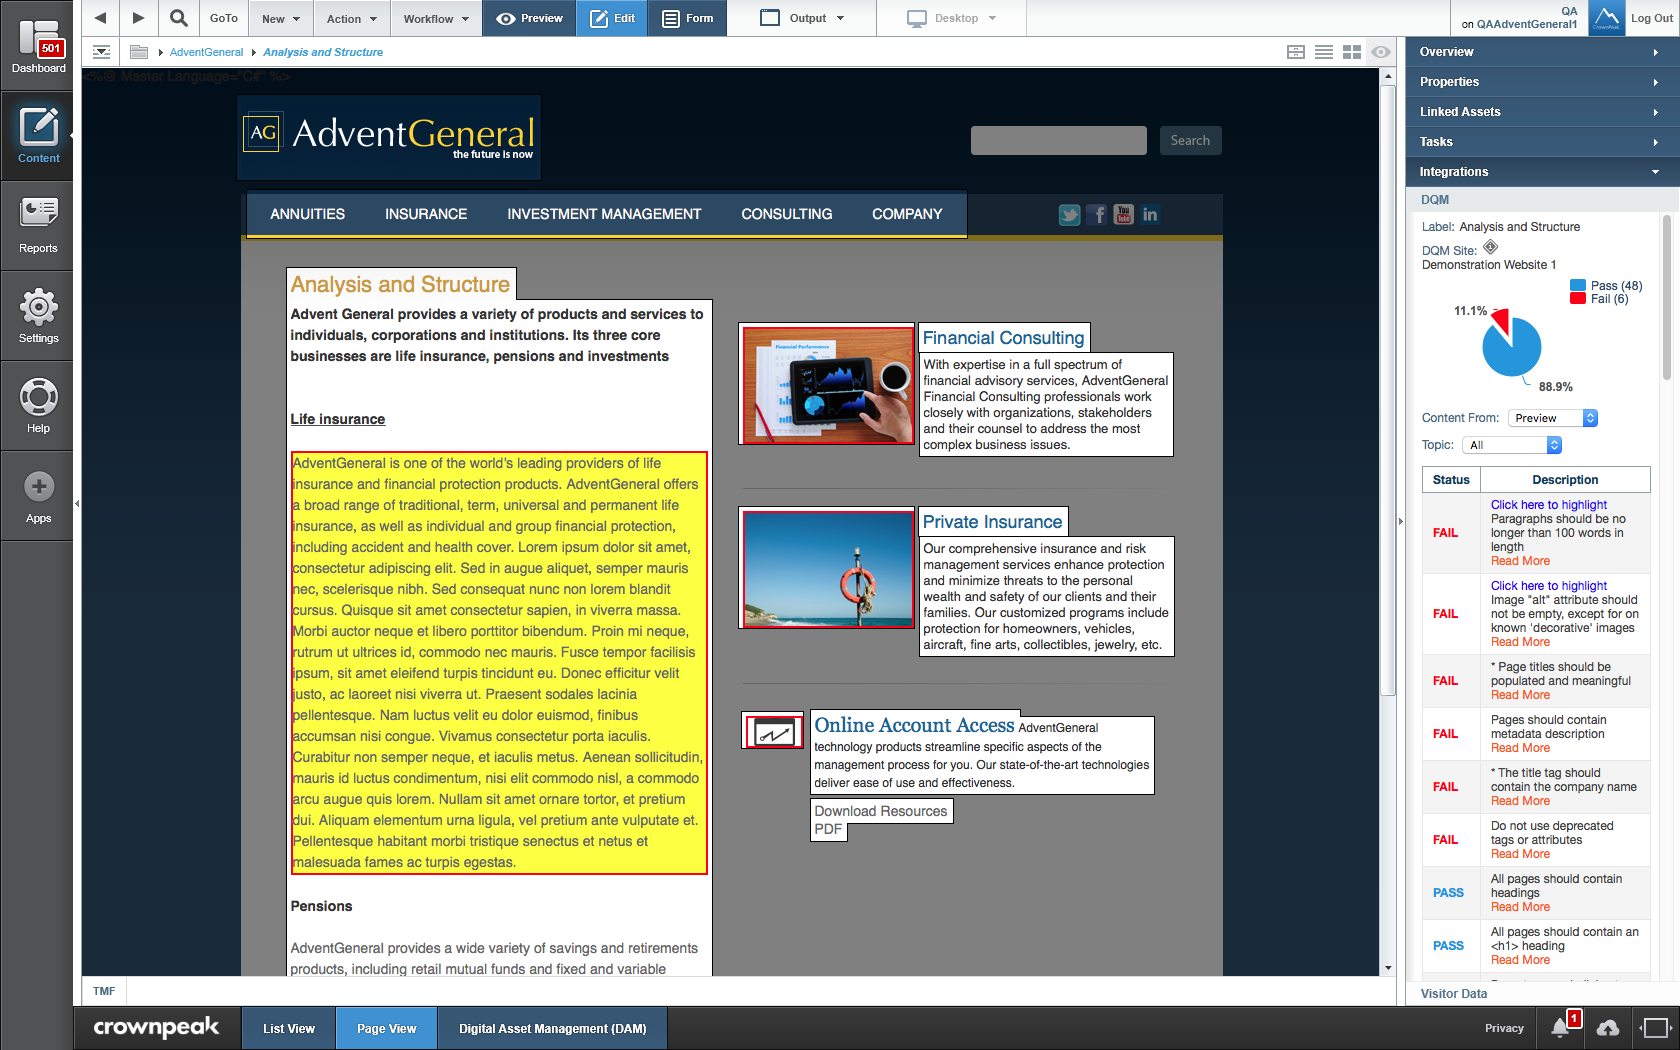 Figure 3 - DQM Error Highlighting
As you can see, the items with a DQM error are highlighted in your Edit window. These highlights correspond to your specific DQM criteria. In this case, the paragraph is highlighted due to having an excess of 100 words, while the images do not have the proper tagging. To further differentiate between the errors, you can select "Click here to highlight" in the list and only that particular error will be highlighted. In our example page, when you select "Click here to highlight" for the paragraph, you will see only that error highlighted. (Figure 4)
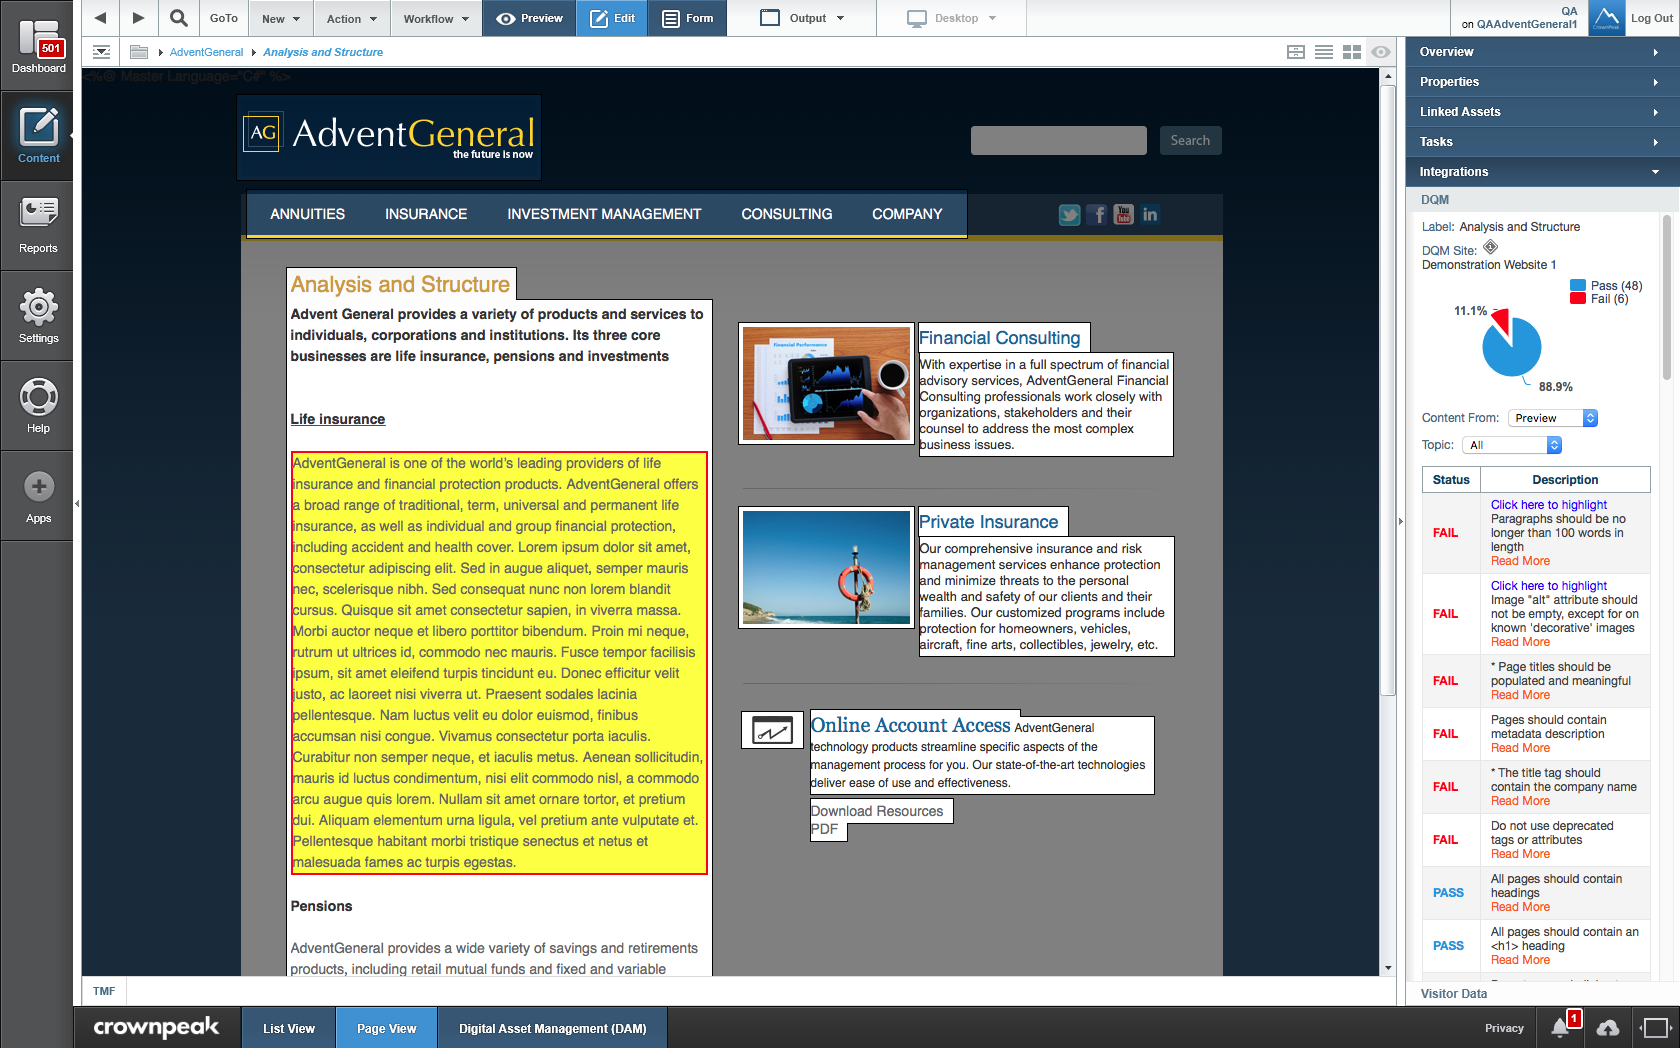
Figure 4 - Paragraph Error Highlighted
Once you Save your edits and go back to the asset Preview you will no longer see the error highlights, however, the Pie Chart and Table will remain in the tab
Dashboard Widget:
The DQM dashboard widget will list all the assets that have had DQM run against them. When you click the arrow, the full results for the page will display. Figure 5 shows the list of assets in the dashboard, while Figure 6 displays the additional DQM information.
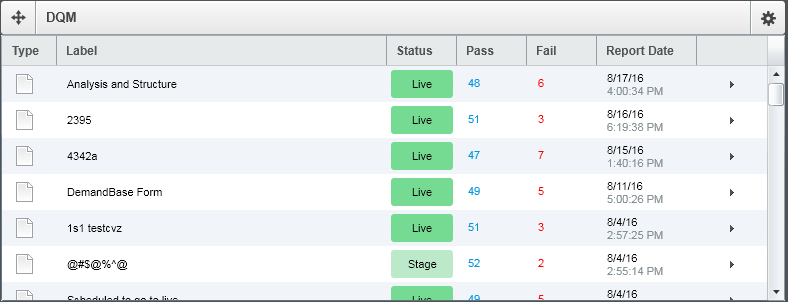
Figure 5 - DQM Dashboard Widget - Asset List
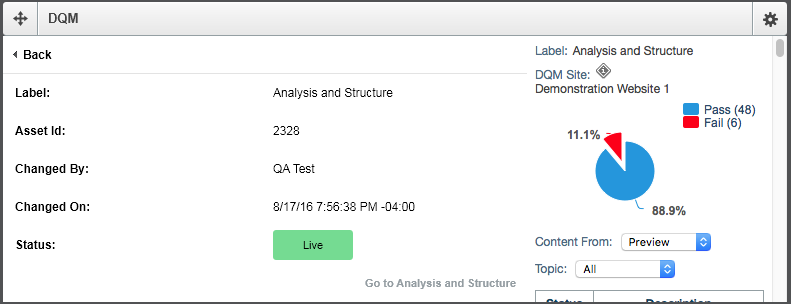
Figure 6 - DQM Dashboard Widget - Additional Information
DQM in V3
The DQM functionality has been added to V3. The current implementation works as described above with the exception of the text highlighting while editing the asset. This aspect of DQM will be added in the near future.
Note: In order to use DQM in V3, you must have the Connector set up in Volte.
To access your DQM instance from V3, simply click the DQM icon in the far left navigation bar. (Figure 7)
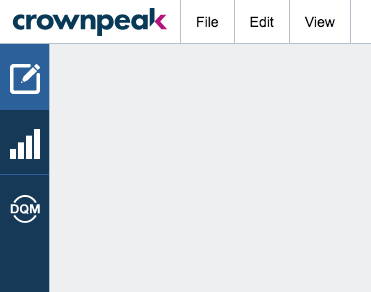
Figure 7 - DQM Access V3
Since V3 is panel based, you need to add the DQM panel to your view in order to see the information. To add the DQM panel, select View -> Digital Quality Management (Figure 8)
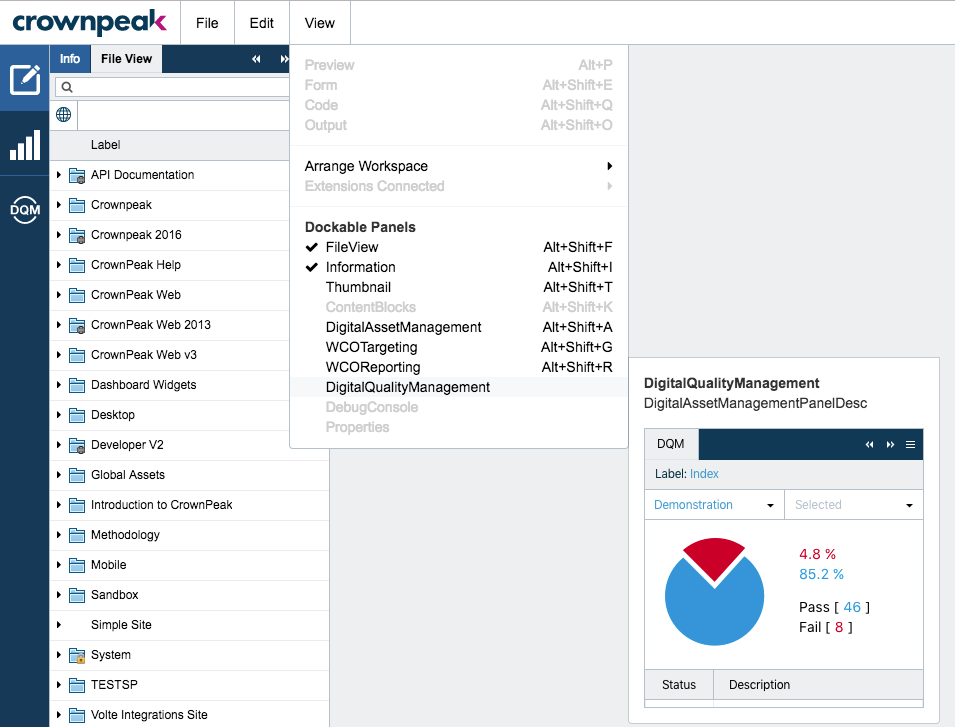
Figure 8 - Adding the DQM Panel
Once the DQM panel has been added, it will display your data in the panel. When you select a templated asset, the DQM data will automatically appear in the panel, provided the asset has a published state. As in Volte, you can select to view different data in the panel (All, Accessibility, Brand, Legal, SEO and Usability) for the Preview or published states. The chart and table will reflect your particular rules set up in DQM. (Figure 9)
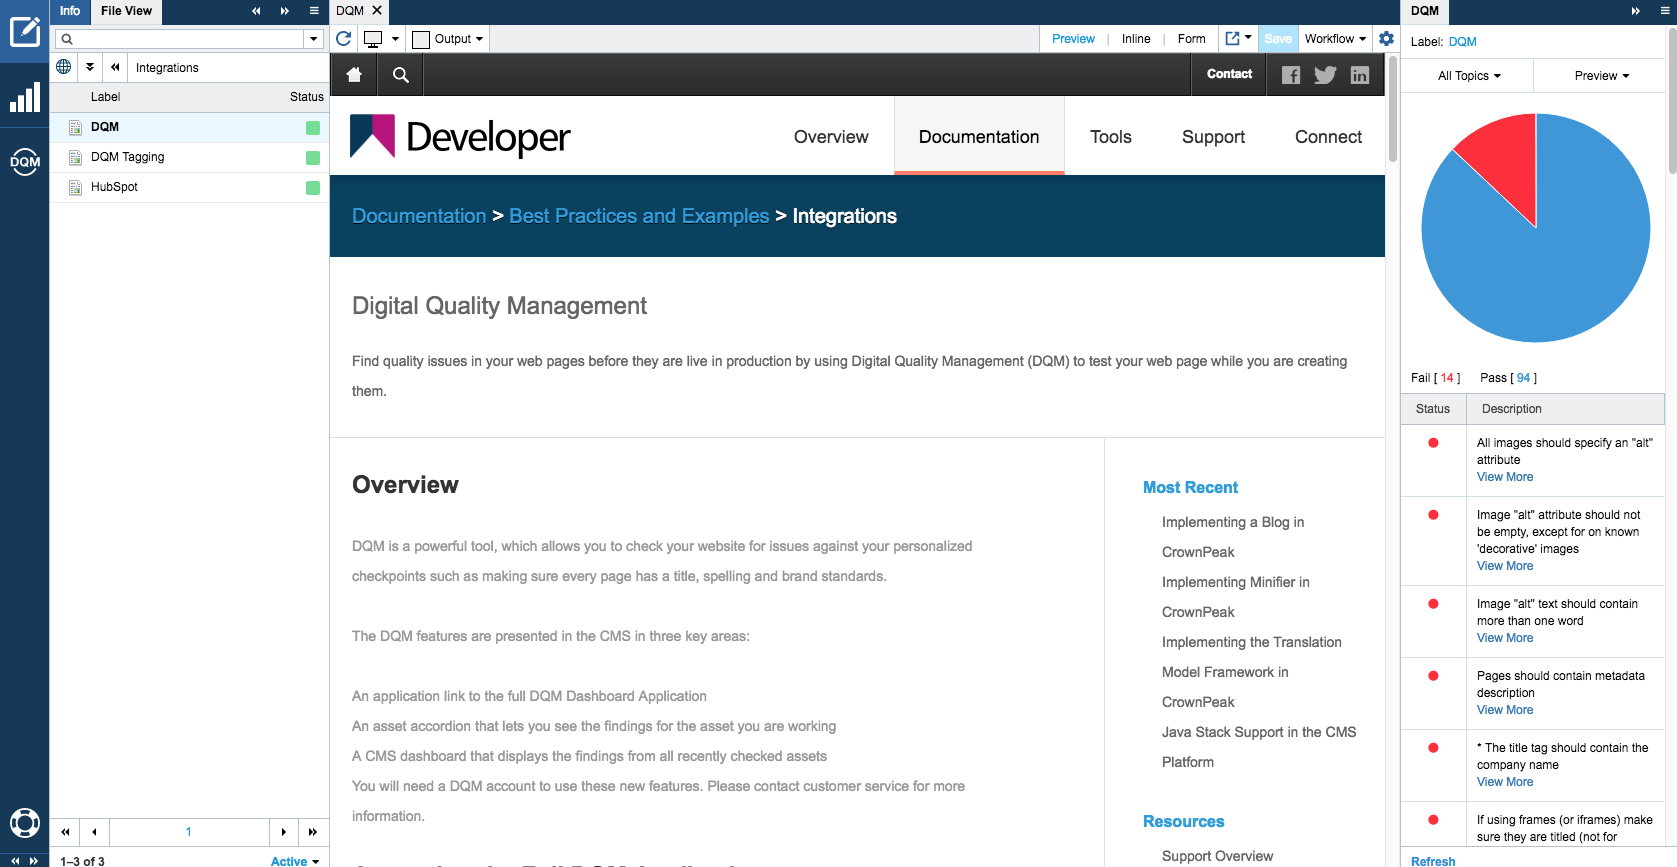
Figure 9 - DQM Panel Data