Overview
The Debug Console offers an easy way to determine why a CMS asset is not working as expected. The Debug Console in the CMS offers many features which can be found in other popular debugging tools. The Debug Console will return warnings and error messages along with debugging statements for the selected asset. All Assets are run through a code analyzer and the results are be displayed in the Error List. Additional Lint analysis will be performed on (template) assets with the extensions .apsx, .asp and .html, which may result in additional messages in the Error List.
Some highlights of the Debug Console include:
- Template debugging by using Out.DebugWriteLine statements
- Both Compiler and Parser errors and warnings
- Ability to jump to the error by clicking the error message
- Ability to use the Debug Console within the Volte window or as a separate window you can move around your screen
In order to use the Debug Console, you must turn on the option in your User Preferences. To access the Debug Console, perform the following:
1. Select [Settings] [Account] [User Preferences]
2. Scroll down to [Debug Preference]
3. Select [Show Debug Console]
4. Click [Save]
5. In your toolbar, you will see a bug icon
6. To start the Debug Console, select the bug so it turns blue (Figure 1)
![]()
Figure 1 - Debug Console Activation Icon
Debug Console
The first tab is the Debug Console. This tab is useful when trying to debug a template. The window will display debug statements within the template. In order to view the debug statements first turn on the Debug Console, then select the asset. Any debug statements within the template will appear on the Debug Console tab as shown in Figure 2 below.
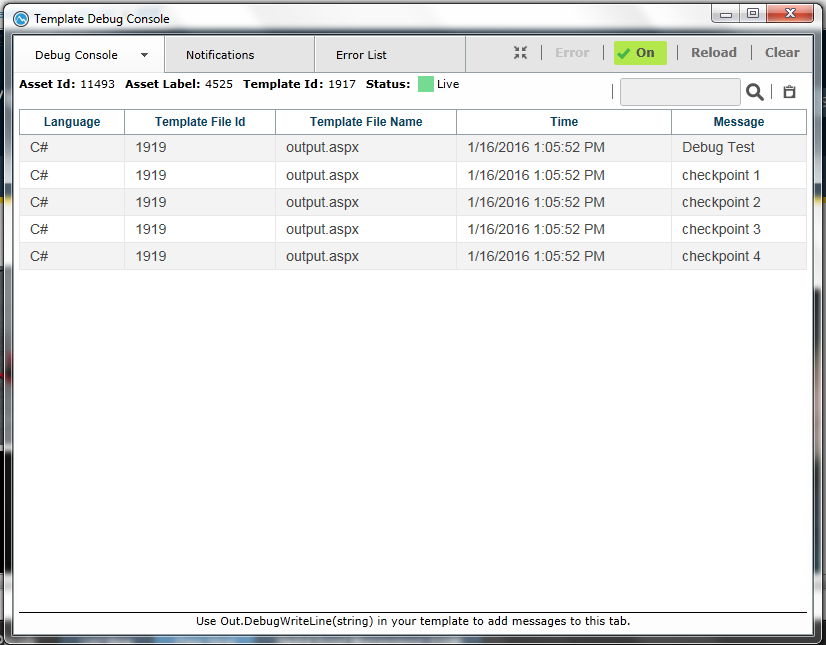 Figure 2 - Debug Console Tab
Notifications
The second tab is Notifications (Figure 3). These are the same messages which appear in the Activity Monitor. The list displays helpful messages which result after an asset is saved. In order to see the entire notification message, click Expand on the right side of the message bar.
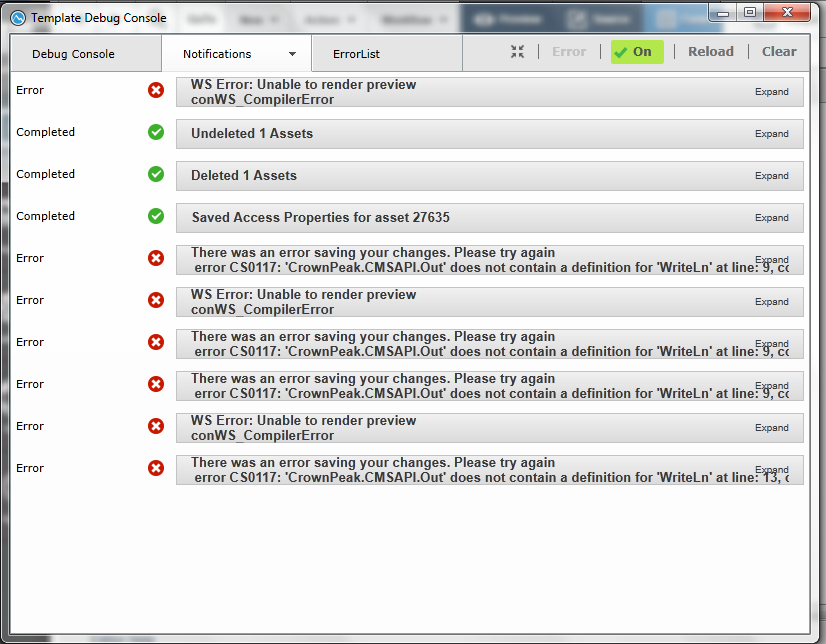 Figure 3 - Notifications
Error List
The final tab is the Error List (Figure 4). This tab displays all the warnings and error messages generated when attempting to Save the asset. Upon clicking Save, the code analyzer will review the code and the Error List will display both compiler and parser erorrs and warnings. Typical Template Assets with an .asp, .aspx and .html extension will have additional Lint analysis performed which may result in additional error and warning messages in the window.
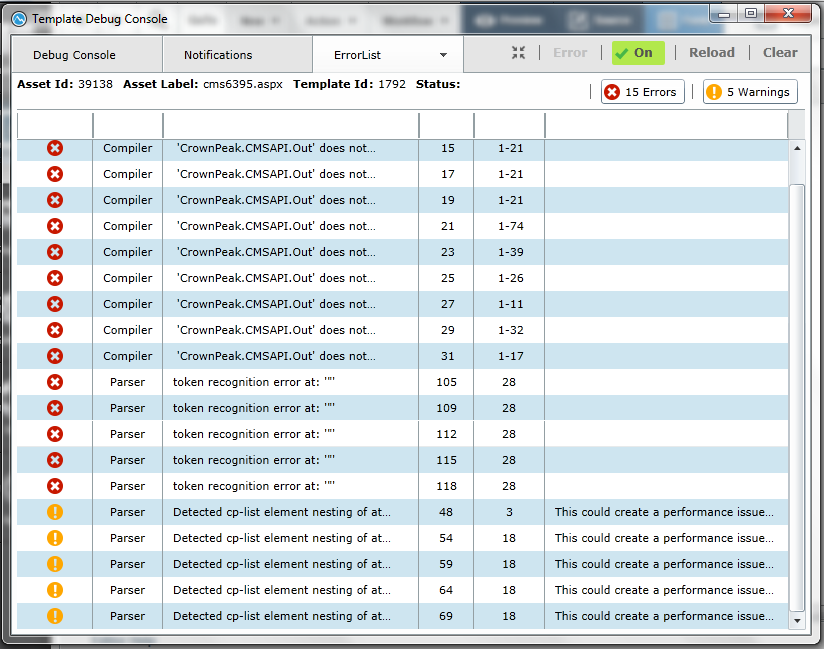 Figure 4 - Error List
| Label | Information |
|---|---|
| Severity | Error or Warning |
| Source | Compiler or Parser |
| Message | Information on the error/warning to assist in debugging |
| Line | Line number - Double click this to jump to the error line in the asset |
| Column | Column number range for the error/warning |
| Extra | Additional information which may prove useful in determing the root of the issue |
v
Debug Console Tips
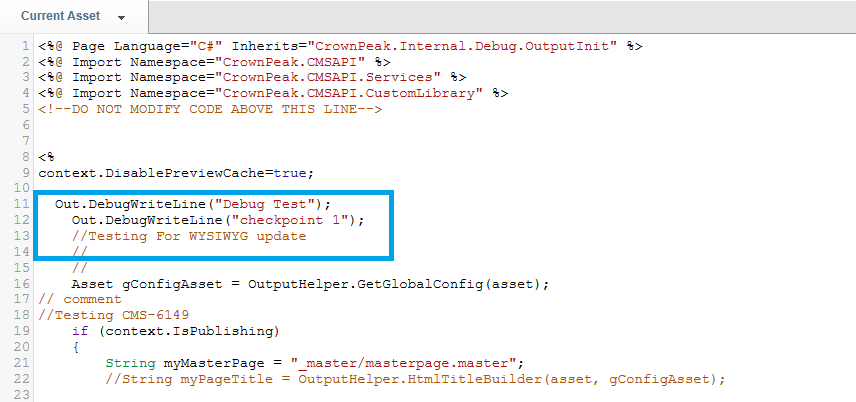
- Insert Out.DebugWriteLine("checkpoint") statments to a template when adding something new to determine if the new code is causing an issue
- Instead of searching for the line number of the error, simply click on the message in the Debug Console and be taken to that line number in the asset.
- After making updates to an asset, click Reload on the Debug Console to re-run the code through the analyzer.
- The maximum number of errors and warning is 50 apiece, this means up to 50 warnings will display and up to 50 errors for a total of 100. If you have more than 50 errors, when one is fixed, the next one on the list will be displayed. The process will repeat until there are 50 or less messages.