Overview
The Funnel Dashboard presents a set of widgets that enable you to track the progress of your attribution model efforts for each of your website properties.
Attribution is the process of identifying user actions which result in the desired outcome. On your website your end-goal is for the visitor to have a conversion experience, that is, buy a product, download a white paper or fill out a form. Using a combination of an attribution model and the funnel dashboard, you can determine which webpages work better in order to achieve a conversion. The attribution model and Funnel Dashboard will only provide accurate data when there is a set of WCO snippets which are dependent on each other, (i.e) you must click the link on page 1 in order to get to the next page in the series, the report information will not be accurate if you can access the successive pages from an outside source.
There are a few major players when analyzing your website: A/B Testing, Personalization and Targeting. By analyzing the data from the website, you can not only improve the website experience, but also keep the user engaged until a conversion is reached.
WCO can be used provides multiple ways to test content, capture form data, and target content to specific users.
- Targeting and content optimization
- A/B and multi-variant testing
- Form building and processing
- Call to action and conversion links
- Real-time analytics and reporting
- Backend third-party integrations
Using the WCO testing and targeting features will allow you to focus a website visitors experince. The Funnel Dashboard provides information on website visitors and conversions charted over time. The information is based on demographics according to; browser, operating system, screen size, country and language along with any referral sources and dynamic content. By reviewing your collections in a funnel report you can see if one particular set of pages result in more conversions than another.
Funnel Report
The first widget is the Funnel Report. This is a powerful tool, which can be used to easily design an attribution model that can determine which combination of messaging and targeting will result in the highest level of conversions. The Funnel Report illustrates your visitors’ progress through the important conversion paths on your site (Figure 1).
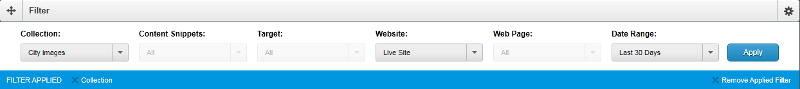
Note: The results on the Funnel Dashboard widgets is based off the collection selected in the top filter. For each collection you must change the filter to review it's results.
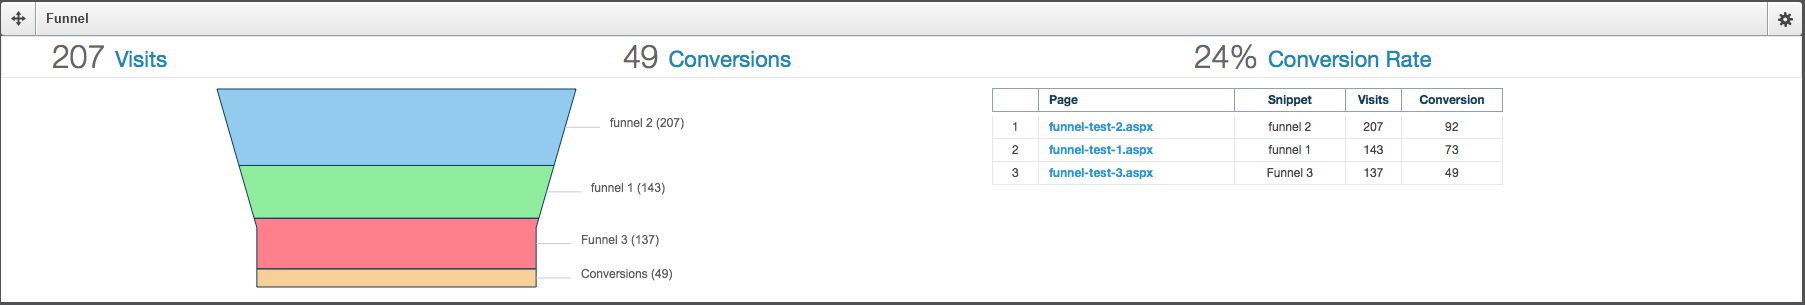
Figure 1 - Funnel Report
The Funnel Report displays the following:
| Widget Item | Description |
|---|---|
| Visits | The total number of visits to the initial page of the snippet collection |
| Conversions | The total number of conversions |
| Conversion Rate | The percentage of conversions determined by initial visits divided by conversions |
| Funnel Chart | Chart displays from top to bottom the initial visits to the conversions with each intermediate page visited |
| Snippet Table | List in order of the pages in the attribution model with: |
Demographics Report
The second widget is the Demographic Report. This widget profiles the four primary demographic characteristics of your website visitors. This includes; web browsers, operating systems, and screen resolutions.
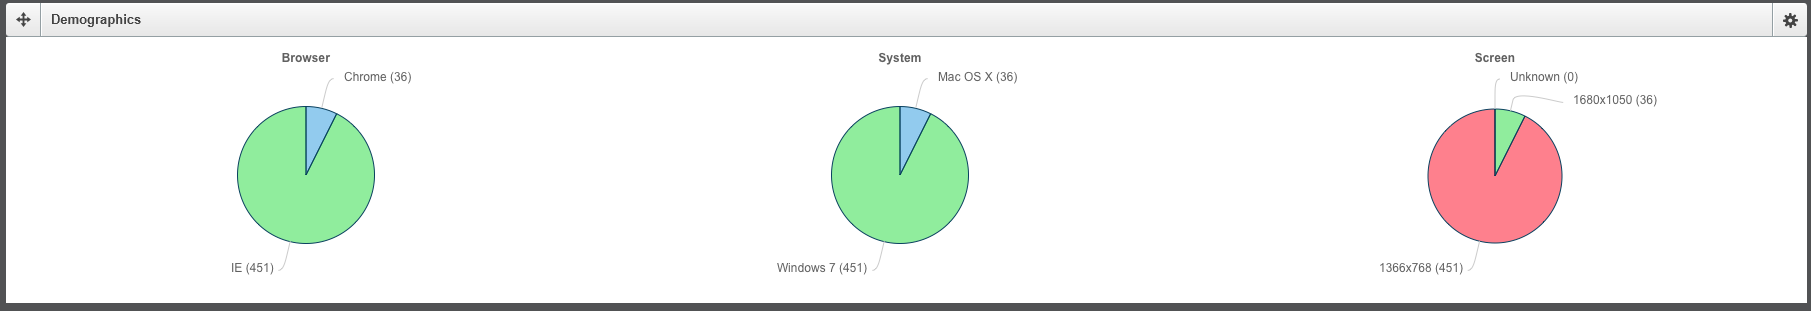
Figure 2 - Demographics Report
| Graph | Use Case |
|---|---|
| Browser | Browser used to access the website; Internet Explorer, Safari, Chrome, Firefox |
| System | Operating System used to access the website; Windows 7, 8, 10, Mac OSX |
| Screen Resolution | Screen Resolution from 640 x 1024 to 1200 x 1920 |
Source Report
The final dashboard widget is the Source Report (Figure 3). This widget displays how the visitor arrives at the website. Again this is based off the the arrival at the initial webpage in your collection.
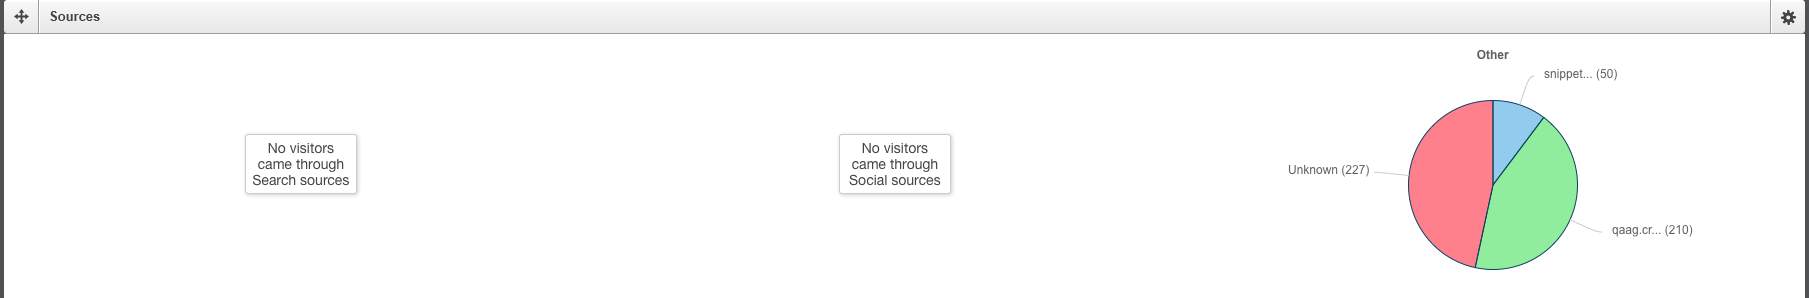
Figure 3 - Source Report
| Graph | Use Case |
|---|---|
| Search | Search engines used to arrive at your website |
| Social | Social media used to errive at your webiste like Twitter or Facebook |
| Other | Other ways visitors arrived at your website, for example typing in the web address |
Funnel Dashboard Tips
The Funnel Dashboard uses a single collection to create the report and chart data. This means the dashboard can be used to compare collections and how effective the testing and targeting snippets are working to pull a visitor further into your website in order to reach a conversion.
Lets look at this scenario - You are trying to determine which set of graphics will entice a user to click through to download a whitepaper.
Both collections use the following scenario:
- A landing page
- An intermediary page
- A final page to click the conversion link
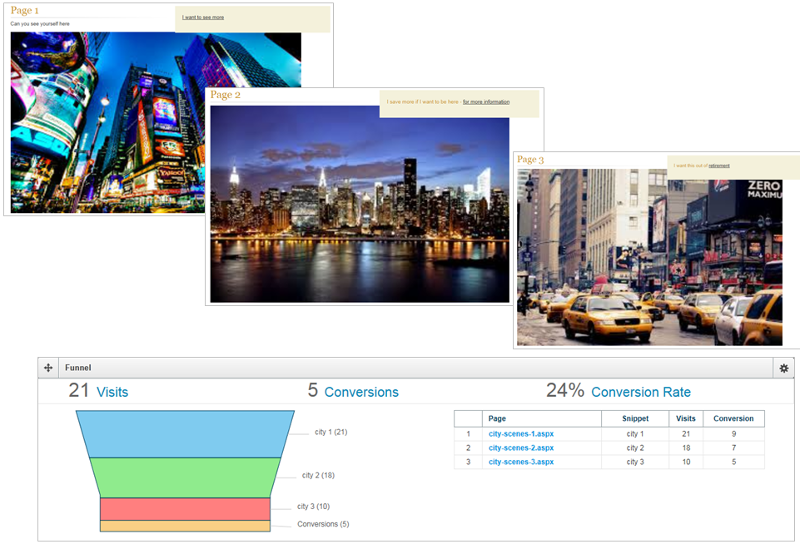
Set A: Is a series of webpages with city images. To see the results for this scenario, filter on the Collection, in this case City images
For this set of images, you have a 24% conversion rate. Nevertheless, you can glean from the Funnel report, that after page 2, you lose approximately 50% of visitors; page 2 has 18 visitor but page 3 only has 10. However, there is a fairly good conversion rate once the visitor reaches page 3. Therefore, you might want to consider changing the images on page 2 to increase the conversion rate.
Set B: To see the results for your alternate images, beach scenes, re-filter on the beach collection. From the chart, you can interpret the fact you keep most visitors throughout the process, but only convert 26% of those visitors. For this scenario, you might consider changing the last page to increase the conversion rate.
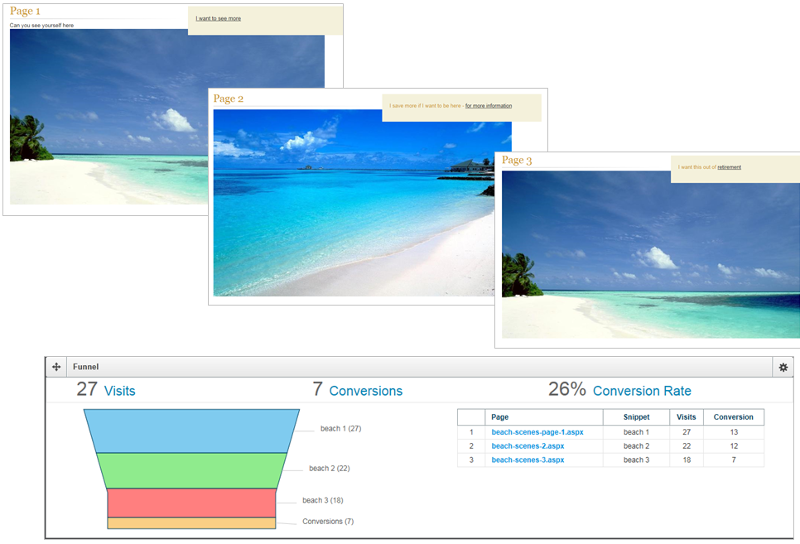
As a whole, the results show that using the Beach scenes seem to draw more visitors and create more conversions. However, with the close results, you might want to tweak the graphics at the funnel drop-off points and continue to test for your web campaign.
For more information on how to set up WCO snippets and Collections please see the Best Practices section of Developer.Crownpeak.Com and Connect.